Soluções Financeiras Inteligentes

Oferecemos robôs de análise de AI para otimizar suas operações no mercado financeiro Forex.

Análise de Mercado
Hands typing on a laptop keyboard with a screen displaying financial graphs and stock market data. Multiple charts and numbers are visible, indicating online trading or financial analysis.

Robôs que analisam tendências e ajudam na tomada de decisões financeiras estratégicas.

A hand holds a smartphone displaying a financial chart with candlestick patterns. In the background, a large, similar financial graph is visible on a screen, featuring fluctuating lines and data points.
A person holding a smartphone with a financial application open on the screen, standing outside a modern glass building. The background shows a plaza with trees and pedestrians.
Automação de Trading

Soluções automatizadas para maximizar lucros e minimizar riscos em suas transações financeiras.

Consultoria Personalizada

Apoio especializado para desenvolver estratégias financeiras adaptadas às suas necessidades.

Soluções Financeiras

Robôs de análise de AI para o mercado financeiro Forex.
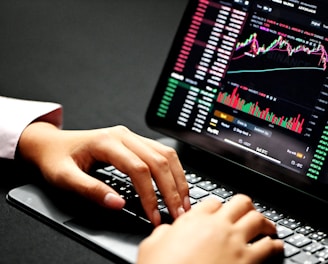
A digital financial chart with green and red zigzag lines on a dark background, representing market trends. Below the main graph, there are smaller charts featuring bar indicators in red and blue, along with a yellow line graph.
Análise de Dados

Utilizamos inteligência artificial para oferecer análises precisas e eficientes, ajudando nossos clientes a tomar decisões informadas no mercado financeiro, especialmente em operações de Forex e investimentos.

A hand is holding a smartphone displaying a financial chart with fluctuations in orange lines. The background features blurred computer screens with a dark theme.
Tecnologia Avançada

Nossos robôs utilizam tecnologia de ponta para otimizar estratégias de investimento, proporcionando aos nossos clientes uma vantagem competitiva no mercado financeiro global, com análises em tempo real e relatórios detalhados.

woman wearing yellow long-sleeved dress under white clouds and blue sky during daytime

Os robôs da Artec transformaram minha abordagem no mercado Forex, trazendo resultados surpreendentes e consistentes.

João Silva

A laptop and smartphone are placed on a wooden table. Both devices display financial charts and data, suggesting involvement in stock trading or market analysis. The setting appears to be indoors with natural light coming through a window.

A análise de AI da Artec é impressionante, ajudando a tomar decisões financeiras mais informadas e seguras.

Maria Costa

A hand is holding a smartphone displaying a financial application. The screen shows a chart with a growth prediction in percentage, and sections labeled Personal, Retirement, and Custodial. The chart predicts cash invested and saved over a period of time, with specific dollar values provided for future growth.
★★★★★
★★★★★